Machine Learning Tutorial - Random Learning
The key to understanding machine learning is to break it down to first principles. At its core, machine learning is about automatically making, updating, and validating predictions. While there are many elegant ways to accomplish this, it is helpful to start with a simplified model and build from there.
Introduction
This tutorial walks through the process of making and testing predictions for a data set by using random weights to generate predictions and then testing those predictions against the labels. To construct the dataset, the following weights were applied to the input features to generate the labels:
[0.17, 0.22, 0, 0.36, 0.27]If the weights multiplied by the features result in a value greater than the threshold of 0.5, the labels row is marked with a classification as true, otherwise it is marked as false.
Wrangling
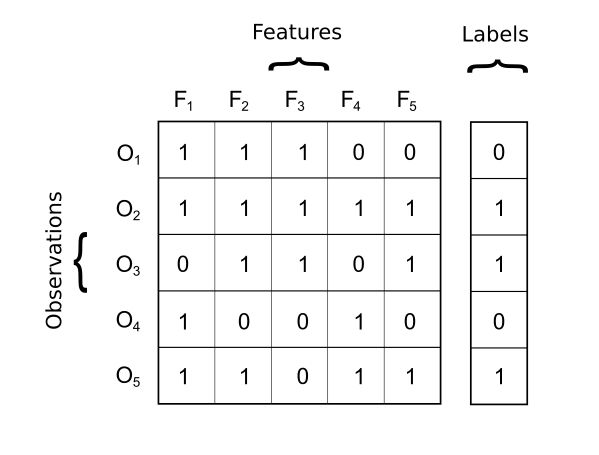
 The code and data for this tutorial are available here. The provided sample data contains six columns. The first five columns represent the features while the sixth column represents the labels. The visualization above demonstrates how the process_data method (shown below) splits the features and the labels into separate objects.
    def process_data(self):
        """split the data into inputs and labels"""

        # Count the input parameters by subtracting the labels column from the fields
        self.feature_len = self.data.shape[1] - 1

        # Transpose the input fields and store
        self.inputs = self.data[:,:self.feature_len].T

        # Transpose the labels field and store
        self.labels = self.data[:,self.feature_len:].T

        # Calculate the prior
        self.prior = np.average(self.labels)

        # Use the prior to get a baseline accuracy
        self.prior_accuracy = np.around(max(self.prior,1 - self.prior),decimals=2)

        # Initialize weights to zero
        self.w = np.zeros((1,self.feature_len))
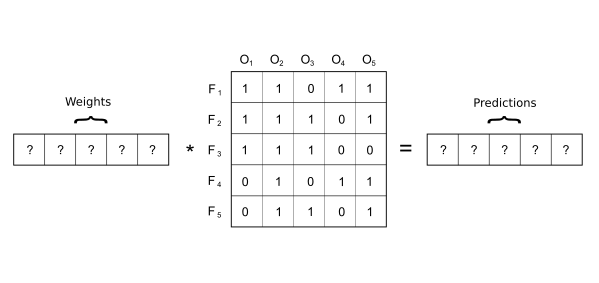
The next stage of the process_data method transposes the inputes and labels so that the tools of linear algebra can be applied.
Analysis
Taking the expected value from the labels results in a probability of about 50%, so always guess true, we will be right about half of the time.
Training
After wrangling the data to a form that we can apply the tools of linear algebra, the next step is to train the model by using the randomly generated weights to make predictions and then testing accuracy of the predictions generated by those weights. If the accuracy is better than the previously best weights, the weights will be updated.
    def train(self):
        """randomly test weights over the number of trials"""

        # Iterate over n random tests
        for i in range(self.trials):

            # Randomly assign test weights (limited to two decimal places)
            t_w = np.around(np.random.uniform(0,1,self.feature_len),decimals=2)

            # Get the predictions made by the test weights
            preds = (np.dot(t_w,self.inputs) > .5)

            # Get accuracy of predictions
            t_acc = np.average((preds == self.labels))

            # Check the accuracy of the test weight predictions and update accuracy of model
            if t_acc > self.accuracy:
                self.accuracy = t_acc
                self.w = t_w
                if self.accuracy == 1:
                    break
Results
    ~/data_science_first_principles/ ./RandomLearn.py

    ('prior_accuracy:', 0.5)
    ('ground_truth:', '[0.17,  0.22,  0,  0.36,  0.27]')
    ('weights:', array([ 0.3 ,  0.17,  0.02,  0.46,  0.14]))
    ('accuracy:', 1.0)
    ('iterations:', 11742)
Conclusion
Even though there are better techniques available, using random learning to make predictions against a simple data set can yield impressive results. It is also clear that, even when we know the ground truth, there is more than one explanation that can perfectly fit the data.