Simulation - Covid Vaccine Impact
Modeling the implications of vaccine distribution can be daunting, but, with a few basic assumptions, it becomes possible to create a simulation that can be used to run experiments on how various actions might impact the course of the pandemic.
Pandemic Duration with and without Vaccination
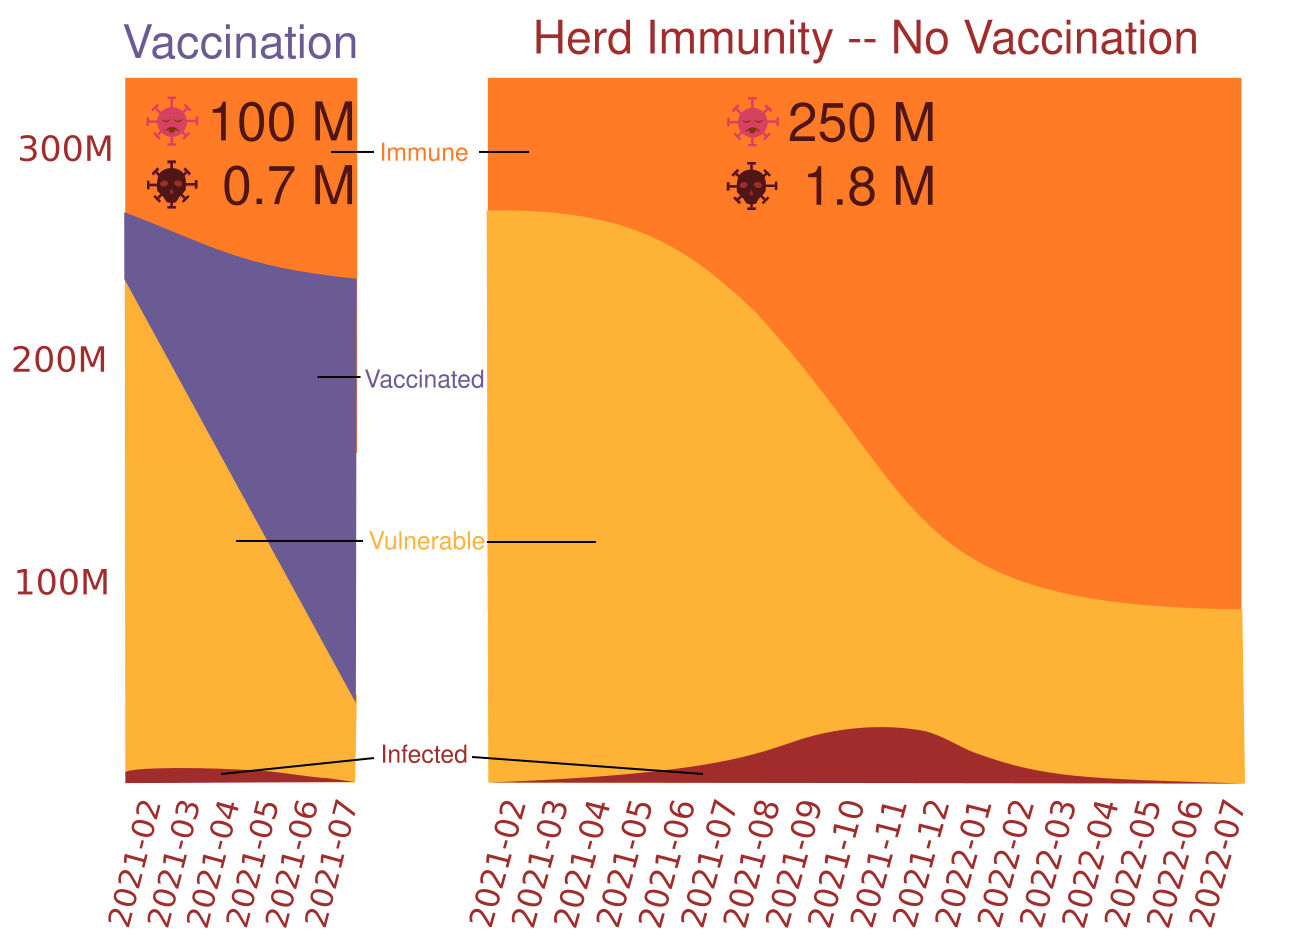 According to the simulation outlined in this post, a universe where 30 million vaccinations are successfully deployed across the United States on a monthly basis until the end of the pandemic would see the pandemic effectively grind to a halt in July of 2021. Alternatively, a universe where there is no vaccine would see the pandemic stretch on for until July of 2022 with over a million additional deaths (~1.7 million deaths total) and 150 million additional cases (~250 million cases total).
Initial State
In order to model the problem, starting with a few basic assumptions can go a long way toward simplifying the entire process. Determining the values to populate the initial state of the world at the beginning of the simulation involves a bit of guesswork. It can be reasonably assumed that the number of covid cases in the United States has been chronically under-reported, but it isn’t clear by how much. To simplify things, the this simulation assumed a fatality rate of 0.7% and worked backword from that to determine total infections to date. This leads to esimations in line with those made by the Economist. Another assumption is that, in most cases, infection confers protective immunity and anyone who has had the virus previously is no longer a vector for spread. This assumption is almost certainly wrong, but is likely true enough to be useful for the time period being considered. Finally, the official number of fatalities is probably too low, but, for this simulation, is a close enough approximation.
total_population = 328200000 # approximate population of the United States
immune = 60000000 # estimate for the number of people in the United States already infected or otherwise immune
infected = 5000000 # estimate for US population currently infected
fatalities = 450000 # approximate fatalities in the United States
herd_immunity = .75
Vaccination Effectiveness
This simulation assumes that vaccinations are 100% effective at preventing transmission. This isn’t true, but they are likely to prove highly effective. Given that the plan is to roll out approximately 34 million per month, this simulation set the number at 30 million to account for this while preserving simplicity.
Infection Patterns
According to research, the distribution of spread has a long tail where about 20% of infected individuals are responsible for about 80% of the spread, while some individuals never pass the virus on to another person. In order to simulate this, the spread distribution below was populated so that 35% never pass on the virus, 20% pass it on to only other person, 20% pass it on to 2 people, 10% pass it on to 3 people, 6% pass it on to 4 people and the remaining 9% represent the long tail where the 99th percentile superspreader infects 13 other people over the course of the their illness. For each infected individual, a distribution pattern is randomly selected as shown below.
individual_spread = lambda x: x[random.randint(0,len(x) - 1)]
spread_distribution = [0] * 35 + [1] * 20 + [2] * 20 + [3] * 10 + [4] * 6  + [5,6,7,8,9,10,11,12,13]
With this distribution, the expected rate of transmission is approximately 2 new infections for every infected person in a population that has no immunity, but behaves similarly to the way people in the United States are presently behaving (some masks, some distincing, some working remotely, some throwing caution to the wind). This distribution highly imperfect, but if you can come up with a better one, feel free to use it since the code for this simulation is available.
Simulation
To understand the simulation, it is helpful to start with the main loop which represents a covid spread generation which lasts a month in our simulation. As long as there are still infected individuals in the current generation and the population hasn’t hit heard immunity, the pandemic rages on. Within each generation the number of immune increases by the amount of those infected (since they will no longer be spread vectors after this generation and can’t get double-covid) along with those who have been vaccinated. The fatalities are estimated to by 0.7% of the infections. The interesting part happens when the spread function acts on the current generation.
while current_gen and immune_pct < herd_immunity:
    immune += current_gen + vax_num
    immune_pct = immune/total_population
    current_gen = spread(current_gen,immune_pct)
    fatalities += current_gen * .007
    print("Infected: ",current_gen/1000,"K", "Immune: ",immune_pct)
Looking inside the spread funtion, if the current generation has 0 cases, there is no spread and 0 new cases are returned. Meanwhile a sample of the next generation is instantiated to hold the results of the Monte Carlo simulation. If there are fewer than 1000 cases in the current generation, than the sample is run across the entire generation. Otherwise, it could take a very long time, so a sample of 1000 is run through the simulation and the spread ratio relative to the sample is multiplied by the current generation to get the number infected in the next generation. To determine the ratio, each case of the sample is assigned a random spread number determined by the distribution defined previously.
def spread(current_gen,immune_pct):
    if current_gen == 0:
        return 0
    sample_next_gen = 0
    sample = 1000
    if current_gen < sample:
        sample = current_gen
    for i in range(sample):
        if random.randint(1,100) <= int(immune_pct * 100):
            continue
        sample_next_gen += individual_spread(spread_distribution)
    next_gen = int(current_gen * (sample_next_gen/sample))
    return next_gen
In repeated simulations without the artificially imposed herd immunity constraint, the virus stops spreading when the percentage of the population with immunity reaches ~75% both wiht and without the vaccine. A virus with the spread profile as defined above just isn’t self-sustaining at immunity levels in the high 70s.
Visualization
The visualization was created using the same technique as in previous posts using SVG.js and Inkscape for the finishing touches. Please refer to the Unusually Mild NYC January visualization post for instructions on building a similar chart.