Visualization - An Unusually Mild NYC January
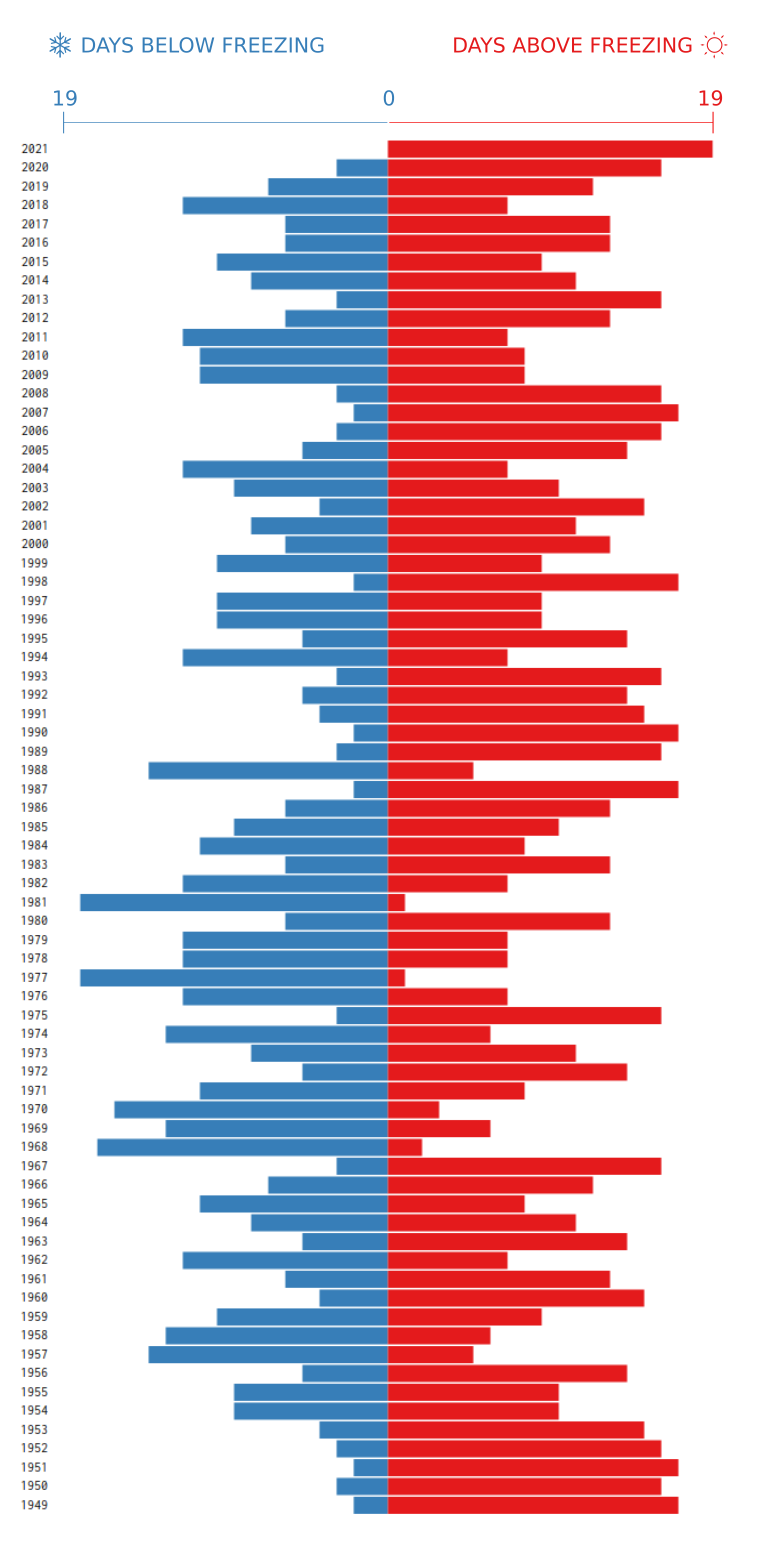
Over the past weekend, I was happy the weather was warm enough to enjoy spending some time outside, but it started me thinking… it’s been pretty warm this year… is this unusual? As it turns out, there hasn’t been a single day where the average temperature was below freezing so far this year in NYC. Surely this must happen from time to time. I decided to check the historical data for every year starting from 1949 for the period of January 1st - 19th … lo and behold, it has never happened in the entire data set until this year! Inspired by Mike Bostock’s D3 implementation of a diverging barchart, I set out to create a similar visualization. I’m comfortable with D3 and use it pretty frequently at work, but found it was overkill for what I wanted to do in this post, so I decided to use the much more streamlined SVG.js. If you want to reproduce my visualization, I’ll walk you through the process below the chart. You can find the code and data for this post here.
NYC January 1-19 Freezing Days by Year
Data Collection
This is probably the most annoying part. You might be able to pull the data from NOAA, but the website crashed every time I tried to pull the history. I ended up putting the history together from a mix-mash of sources including recent data from weather underground. Just get the data in the format below and the rest will be easy. If all else fails, just download a copy of my 1949 - present january summary data. After you get everything, it should look like the table below:
| Date | MaxTempF | MeanTempF | MinTempF |
|---|---|---|---|
| 1949-01-01 | 32 | 29 | 26 |
| 1949-01-02 | 36 | 33 | 30 |
| 1949-01-03 | 39 | 34 | 28 |
Data Wrangling
Now that you have the data, use the following bash commands to create a data set that only has the first 19 days of January for each year. This will work even if you have a data set that includes all months as long as the formatting is the same as above. The key is in the regular expression match on the second line that essentially says, return only January data as determined by the “-01-“ portion of the expresion and where the day is anything under 20 as determined by the “[01][0-9]” portion of the expression.
  $ head -n1 nyc_jan.csv > nyc_early_jan.csv
  $ egrep "\-01-[01][0-9]" nyc_jan.csv >> nyc_early_jan.csv
Next, use python to quickly calculate the number of days below freezing summarized by each year:
#!/usr/bin/env python
import pandas as pd
w = pd.read_csv('nyc_early_jan.csv')
w['freezing'] = w.MeanTempF.apply(lambda x: 1 if x < 32.0 else 0)
w['year'] = w.Date.apply(lambda x: x[:4])
w = w[['year','freezing']]
w.groupby('year').agg('sum').reset_index().iloc[::-1].to_json('freezing_year.json',orient='records')
The “MeanTempF” column represents the average temperature for a particular day. If the temperature was below 32, it gets classified as freezing acroding to the lambda function on the fourth line. The output “freezing_year.json”, can be used as data in the visualization code below.
Visualization
Now, use SVG.js to build the chart using the javascript below:
var data = [] // replace with the data generated in the previous section

// set constants
const EARLY_JAN_DAYS = 19
const SIZE = 20
const SPACER = SIZE + 2
const OFFSET = 50
const WHITE = 'white'
const BLUE = '#377eb8'
const RED = '#e41a1c'
const SCALE = 2400

// build graphics
var draw = SVG().addTo('body').size('100%', SCALE)

for (const i in data) {
  chart(i,data[i].year.toString(),data[i].freezing)
}

// helper
function chart(line,year,freeze){
  var mild = EARLY_JAN_DAYS - freeze;
  draw.text(year)
  	.move(0,line*SPACER)
  	.font({ family: 'Inconsolata', size: 16 })
    .fill('black')
  draw.rect(mild*SIZE,SIZE).y(line*SIZE).fill(WHITE).move(OFFSET,line*SPACER)
  draw.rect(freeze*SIZE,SIZE).y(line*SIZE).fill(BLUE).move(OFFSET + mild * SIZE,line*SPACER)
  draw.rect(mild*SIZE,SIZE).y(line*SIZE).fill(RED).move(OFFSET + (freeze + mild) * SIZE,line*SPACER)
}
If you want, you can use Inkscape to add some finishing touches as I did, but the diverging bar chart looks great!