Visualizing Developer Income by State with D3
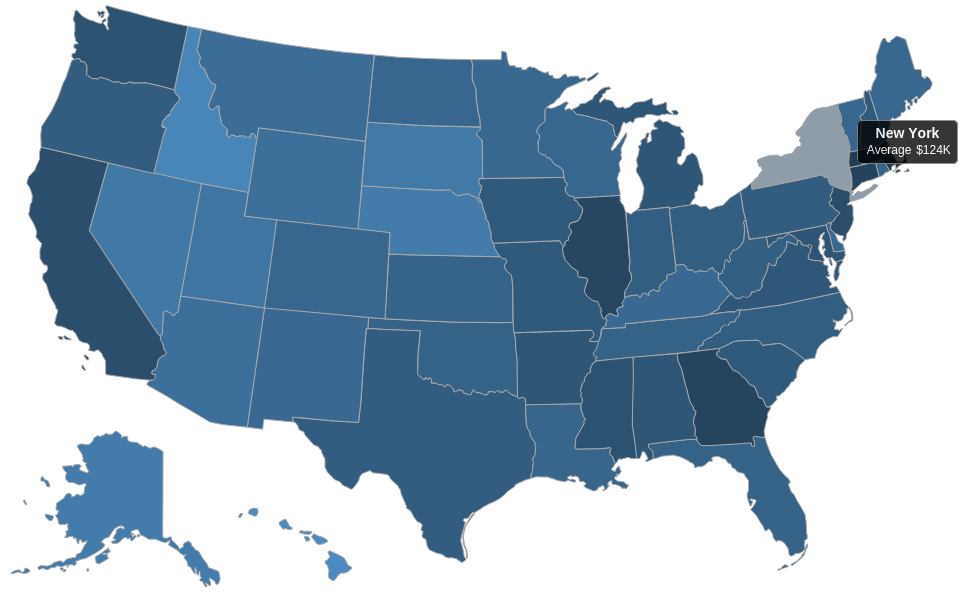
The average salary for developers varies widely across the United States from $129K/year in DC to $63K/year in Hawaii according to salary data from Indeed. Using D3 to create a choropleth map, we can quickly see which states have the most lucrartive tech opportunites.
Live Implementation
You can view a live implementation of this visualization here. The source code is available here.
Creating the Visualization
If you are provided with the D3 javascript state map and indeed salary data, creating the visualization is simple.
First, create a tooltip to view the state’s average developer salary on hover using the following snipit:
function tooltipHtml(n, d){
  return "<h4>"+n+"</h4><table>" +
    "<tr><td>Average</td><td>$" +
    (d.avg) + "K</td></tr>" +
    "</table>"
}
Now use the code below to loop over the data in the provided csv to map it to the javascript state map.
var sampleData = {}
var state_data = []
d3.csv("data/state_data.csv", function(data) {
  state_data = data
  for (var e in state_data){
    var z = state_data[e]
    var i = z["id"]
    var s = z["Salary"]
    sampleData[i]={id:i, avg:s, color:d3.interpolate("steelblue","black")((s -70)/100)}
  }

  uStates.draw("#statesvg", sampleData, tooltipHtml)
});
Conclusion
D3 provides an extraordinarily easy and powerful set of tools for visualizing state level data.