Visualizing Conway's Game of Life with Matplotlib
While working through practice problems on leetcode, I encountered a problem I hadn’t seen for a while, Conway’s Game of Life. After implementing the solution, I decided it would be interesting to take it a step further and generate graphics to display the game.
Updating the Game Board
Even though leetcode only requires the finalized state of a move for its solution, I decided it would be visually more interesting to add a visualization for the spawning / decay cycle between each state move state. To accomplish this I split each move into a starting state and an ending state.
def start_update(self):
    """
    Update the game board in-place to show spawning and dying cells
    """
    self.num_rows = len(self.board)
    self.num_cols = len(self.board[0])
    for i,row in enumerate(self.board):
        i_opts = self.get_opts(i,self.num_rows)
        for j,col in enumerate(row):
            j_opts = self.get_opts(j,self.num_cols)
            pos = [i,j]
            nbs = self.get_neighbors(i_opts,j_opts,pos)
            self.update_tile_value(nbs,i,j)

def finish_update(self):
    """
    Update the game board in-place to show only living and non-living cells
    """
    for i in range(self.num_rows):
        for j in range(self.num_cols):
            self.board[i][j] = self.update_rules[self.board[i][j]]
Adding Output Visualization with matplotlib
With transition and ending game boards now being generated for each round of play, we can generate interesting visualizations with matplotlib easily.
First, we need to import matplotlib. I also suggest turning off the axis labels for this type of visualization.
import matplotlib as mpl
import matplotlib.pyplot as plt
plt.axis('off')
Second, we need to add a visually interesting color map. I always spend way too much time agonizing over the right colors.
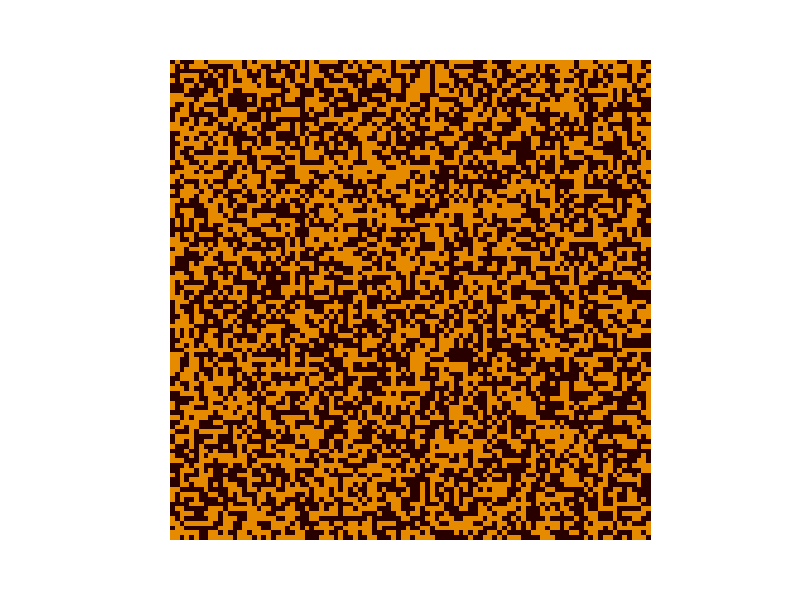
self.cmap = mpl.colors.ListedColormap(['#290000','#CC0000','#800000','#E68A00'])Finally, we can use the code below to output a visualization of the state of the game board to an image file.
def plot_board(self,iteration):
    """
    Output a plot of the board to an image file according to the iteration
    """
    img = plt.imshow(self.board,interpolation='nearest',cmap = self.cmap)
    fig = plt.figure(1)
    fig.savefig("output/t" + str(iteration) + ".png")
Consolidating Output Images Together with ImageMagick
It wouldn’t be as exciting if we just had a few hundred .png images sitting around that we had to look through one by one. As a finishing touch, we can use ImageMagick to consolidate all of our output images into a single consolidated animated gif using the included bash script.
convert -delay 25 -loop 0 t*.png gameoflife.gif