Price Targets a Poor Predictor of Performance
In order to determine the relationship between consensus price targes and stock performance, I decided to measure the accuracy of predictions made from 2013 to the first two quarters of 2014 against the actual results from the matching quarter of the following year.
Visualization
The code for the visualization in R :
require("ggplot2")
df <- read.csv(file="quarterly_stock_data.csv",head=TRUE,sep=",")
ggplot(df, aes(x=df$ProjectedGrowth, y=df$ActualGrowth)) +
  geom_point(shape=1,size=.6,color="steelblue") +
  ylim(-1,2) + xlim(-1,2) +
  xlab("Projected") + ylab("Actual") +
  theme(
    panel.background = element_rect(fill = "transparent",colour = NA),
    panel.grid.minor = element_blank(),
    panel.grid.major = element_blank(),
    plot.background = element_rect(fill = "transparent",colour = NA)
  )
Analysis
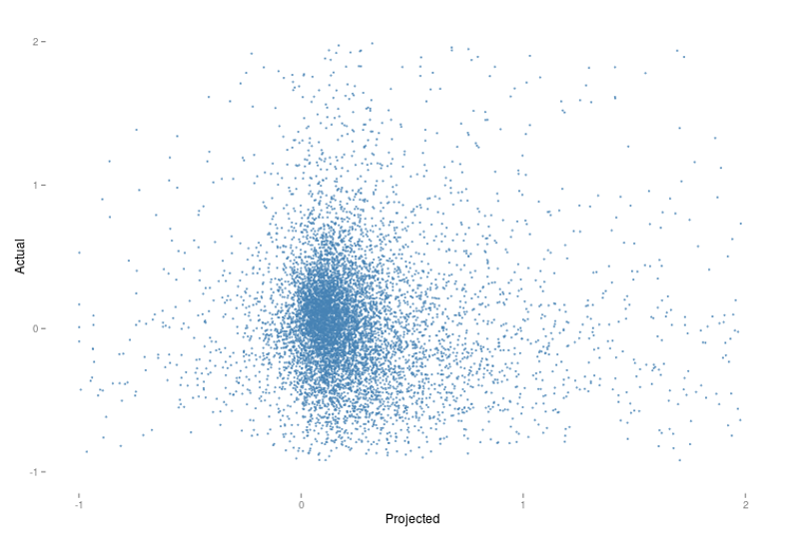
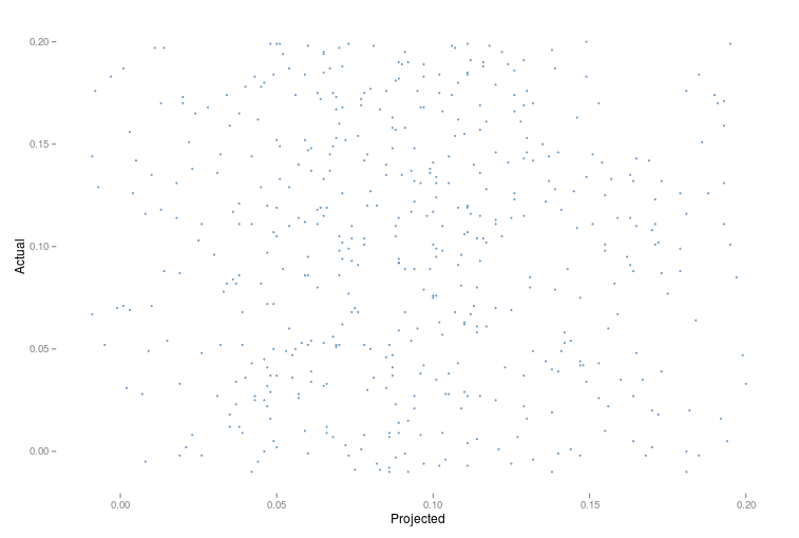
Originally, I had expected to see a visible correlation between the predictions and the results, but the visualization of this relationship shows just how wrong my anticipation was. I decided to see if limiting the sample to stocks from the S&P500 with a narrow prediction window would improve the accuracy. I’ll leave the final interpretation to you, but, to me, the results look pretty random.
require("ggplot2")
dat2<- read.csv(file="quarterly_sp_data.csv",head=TRUE,sep=",")
ggplot(dat2, aes(x=dat2$ProjectedGrowth, y=dat2$ActualGrowth)) + geom_point(shape=1,size=.6,color="steelblue") +
  #ylim(-.5, 1.5) + xlim(-.3,.7) +

  ylim(-.01,.2) + xlim(-.01,.2) +
  xlab("Projected") + ylab("Actual") + theme(
    panel.background = element_rect(fill = "transparent",colour = NA), # or theme_blank()

    panel.grid.minor = element_blank(),
    panel.grid.major = element_blank(),
    plot.background = element_rect(fill = "transparent",colour = NA)
  )
To satisfy my curiosity, I decided to compare the predictive power of the consensus price targets against a the hypothesis that the stock price would remain exactly the same as when the initial observation was made for stocks in the S&P 500.
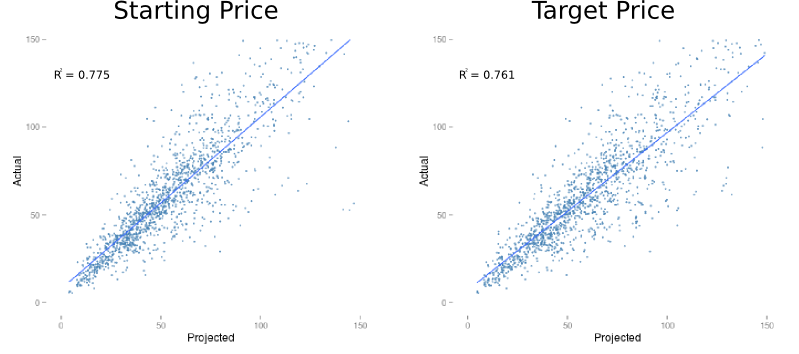
It appears that, for this time period, assuming no change whatsoever would have been a better prediction. My interpretation of these results is not that price targets are useless, but rather that external and unpredictable market forces have far more influence over the performance of a stock.
Here is a sample of the data I used to perform this analysis.
select t1.ticker, t1.yr, t1.qtr, t1.average_price , t1.average_target, t2.average_price,
(t1.projected_growth - 1) projected_growth, round(t2.average_price/t1.average_price,3) - 1 actual_growth
from t_sum t1 inner join t_sum t2 on t1.ticker = t2.ticker
and t1.qtr = t2.qtr and (t1.yr + 1) = (t2.yr)
where t1.ticker = 'AMD' and t1.yr = 2013| Ticker | Year | Quarter | Price | Target | Actual | ProjectedGrowth | ActualGrowth |
|---|---|---|---|---|---|---|---|
| AMD | 2013 | 1 | 2.460 | 2.750 | 3.797 | 0.118 | 0.543 |
| AMD | 2013 | 2 | 3.830 | 2.890 | 3.906 | -0.245 | 0.020 |
| AMD | 2013 | 3 | 3.718 | 4.050 | 3.620 | 0.089 | -0.026 |
| AMD | 2013 | 4 | 3.478 | 4.200 | 2.741 | 0.208 | -0.212 |